
Weekly Market Snapshot
Edition #10

In this edition:
Welcome to Bruin Finance Society’s Weekly Market Snapshot!
Market Snapshot:
Rates, Trends, and Drivers
Key Drivers vs. Headwinds
Three Key Highlights
Deep Dives:
Is Inflation Experienced Equally?
The “Internship Inflation” Problem
Big Tech’s $700 Billion Bet
The Market’s Dependence on Rate Cuts Is Becoming Its Biggest Risk
The Hidden Cost of Private Credit
Peeling Back the Curtain on a Tech-Led Rally
Welcome to Bruin Finance Society’s Weekly Market Snapshot!
Welcome to the Bruin Finance Society’s Weekly Market Snapshot (WMS)! The WMS is built around a simple value proposition: fast, digestible, and dependable updates for UCLA students.
Each edition delivers a structured read that works at two speeds. If you have a few minutes between classes, you can skim the headlines and leave with a clear sense of what mattered and why. If you have more time, you can go deeper into the mechanisms behind the move, the evidence supporting it, and the implications for investors and students preparing for careers in finance.
Here is what you can expect every week:
Market Snapshot:
Rates, trends, and the key drivers shaping pricing across major assets.
Key Drivers vs. Headwinds in the market
Three key highlights that capture recent developments, and the “so what” behind them.
Deep Dives
Longer-form pieces written by BFS members. These will range from technical patterns and indicators to industry shifts and business-model breakdowns.
This week’s contributors: Subai Zheng, Ekaterina Nazarova, Joe Hickey, Sohan Garg, Isaias Plascencia, Gloria Liu
Edited by: Sahil Sudhani
Market Snapshot
Rates, Trends, and Drivers
📉 Market Indexes
S&P 500: 7,398.93 (+2.33% w/w)
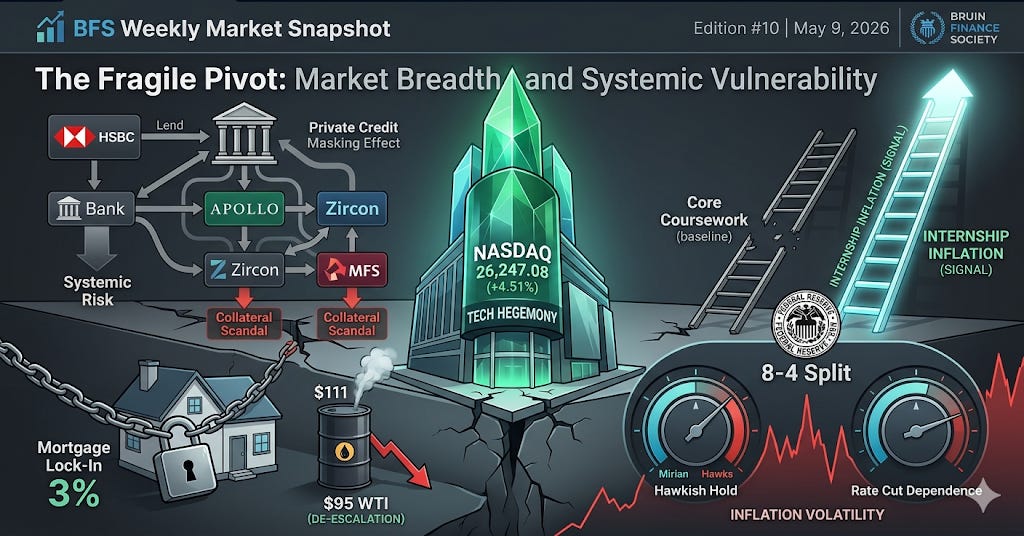
Nasdaq: 26,247.08 (+4.51% w/w)
Dow Jones: 49,609.16 (+0.22% w/w)
Russell 2000: 2,861.21 (+1.72% w/w)
U.S. equities roared back to life this week, led by a spectacular 4.51% surge in the Nasdaq. As WTI Crude finally broke its $100 floor, the “Energy Tax” on the consumer began to lift, triggering a massive rotation out of defensive sectors and back into high-beta growth. While the Dow remained nearly flat—tethered by heavy industrial and energy weightings—the broader market’s move toward the 7,400 level on the S&P 500 suggests that investors are increasingly betting on a “Goldilocks” transition under the incoming Warsh Fed.
💵 Rates
2Y Treasury: 3.893% ↑
10Y Treasury: 4.364% ↓
The “Bull Steepening” of the yield curve continues to be the dominant technical story. The 2Y Treasury ticked higher to 3.893%, reflecting a market that anticipates Kevin Warsh will prioritize price stability over immediate cuts. Conversely, the 10Y Treasury dipped to 4.364%, signaling that long-term inflation expectations are finally beginning to cool as energy prices normalize. This narrowing inversion is a classic signal that the market is preparing for a normalized, albeit higher-rate, economic environment.
🌍 Key Macro
U.S. Dollar (DXY): ~ 97.90 (-0.26% w/w)
WTI Oil: ~ 95.42 (-6.40% w/w)
Gold: ~ 4,714.89 (+2.17% w/w)
The “Fear Trade” officially inverted this week. WTI Crude plummeted 6.4% to settle at $95.42, its lowest level since the initial Hormuz escalation. Interestingly, Gold surged 2.17% to $4,714, diverging from oil. This suggests that while energy fears are receding, institutional investors are still hedging against currency volatility and the structural debt risks highlighted by Jamie Dimon. The DXY softened to 97.90, providing a tailwind for multinational earnings as the greenback’s safe-haven premium eroded.
Key Drivers vs. Headwinds
🟢Nvidia (NVDA)
▲ +6.8% w/w: The undisputed king of the AI stack reclaimed its momentum as energy costs cooled. With the “power constraint” narrative easing slightly due to lower oil/gas prices, investors piled back into NVDA, betting that data center CapEx will accelerate in a more stable macro environment.
🟢Carnival Corp (CCL)
▲ +5.4% w/w: As the “Conflict Proxy” trade unwound, travel and leisure surged. Lower fuel costs (WTI -6.4%) directly translate to expanded margins for cruise lines, making CCL the primary beneficiary of the “Peace Dividend” rally.
🔴ConocoPhillips (COP)
▼ -5.2% w/w: The upstream energy giant faced a brutal week as the oil floor collapsed. With WTI dropping toward the mid-$90s, the windfall profit expectations that drove the stock in early 2026 are being rapidly repriced.
🔴Newmont Corp (NEM)
▼ -3.1% w/w: Despite gold prices rising, the world’s largest gold miner struggled as rising labor costs and the 2Y Treasury tick-up (3.893%) increased the opportunity cost of holding non-yielding assets. NEM is currently being treated as a “funding source” for the rotation back into tech.
Three Key Highlights
1. The “Warsh Handover” & The Independence Premium
As Kevin Warsh prepares to take the gavel on May 15, the “Warsh Discount” is being applied to the dollar and a “Warsh Premium” to equities. The 13-11 Senate vote confirmed a shift toward a more market-centric Fed. Investors are betting that Warsh will move away from the “data-dependent” reactive mode of the Powell era and toward a more proactive, rules-based framework. This clarity is driving the Nasdaq’s outperformance, as growth investors prefer a predictable, hawkish leader over an unpredictable, reactive one.
2. Oil’s $100 Floor Shatters: The “Supply Corridors” Reopen
The 6.4% collapse in WTI Crude marks a regime shift in the 2026 energy market. Unverified reports of a “Technical De-escalation” in the Strait of Hormuz have led to a sudden rush of insurance underwriting for tankers, effectively reopening global supply corridors. This $95 oil settle is a massive relief valve for global consumption. If this price level holds through May, it effectively kills the “Stagflation Trap” narrative, giving the Fed the green light to focus on the softening labor market rather than runaway energy costs.
3. The Return of the “Tech Hegemony”
The Nasdaq’s 4.5% jump this week marks the return of Tech Hegemony. For the last two months, “Old Economy” trades (Energy, Defense, Utilities) outperformed. This week, that trend inverted completely. The “Magnificent Seven” and the “Scarcity Trade” (Seagate, ASML) are once again the market leaders. This suggests that the market has processed the geopolitical risk and decided that AI infrastructure remains the only true “secular growth” story in an era of 4% inflation and 3.9% short-term rates.
Deep Dives
Is Inflation Experienced Equally?
By Subai Zheng
Speaking of the word “inflation,” many assume it to be a universal phenomenon that applies to everyone equally. But is it truly a fair experience for groups on different economic tiers?
When examining inflation closely, it is clear that it strikes different populations to different extents. For higher-income households, inflation might mean paying more for dining out, travel, or luxury purchases. Yet, for lower-income households, inflation targets daily essentials. It means paying more for groceries, transportation, and rent. In 2024, households in the lowest income bracket spent approximately 33% of their income on food, compared to just 6% for the highest-income households. These are not discretionary expenses that can be easily cut; they represent the core of their total spending. When prices rise, someone spending a third of their income on essentials feels the impact far more significantly than someone spending only a small fraction.
Moreover, wealthier individuals are more likely to own assets—such as stocks or real estate—that often rise with or even outpace the inflation rate. As a result, inflation for them is not necessarily a burden; it can occasionally bring unexpected benefits. Conversely, those who hold most of their income as cash have a completely different experience. Their money steadily loses purchasing power as prices climb.
Inflation is, therefore, not an equal experience, but a phenomenon that quietly redistributes wealth away from those least able to absorb the shock. If inflation is not experienced equally, then standard policies and advice for countering it often fall short. Telling people to “cut spending” or “just invest” ignores the structural differences in the economic conditions of various groups. Ultimately, inflation is not just a general rise in prices; it is a distributional shock that deepens inequality. Effective solutions require more than individual budgeting strategies—they require policies that account for these vastly different starting points.
The “Internship Inflation” Problem
By Ekaterina Nazarova
There is an unspoken shift happening in finance recruiting, and most students feel it before they can articulate it: one internship is no longer enough. What used to be a differentiator has quietly become the baseline. Today, competitive candidates often arrive at junior-year recruiting with two or even three prior internships, sometimes before they have even completed their core finance coursework.
At first glance, this appears to be a simple case of rising standards. However, that framing misses the deeper dynamic: this is not just competition; it is path dependency. Early access now compounds. A freshman who lands a small boutique role gains the resume credibility required to unlock a sophomore internship, which then serves as the launching pad for junior-year recruiting at firms like Goldman Sachs or JPMorgan Chase. Meanwhile, equally capable students who start later face a steeper climb—not because of a lack of ability, but because they missed the first step of the sequence.
In my view, internship inflation has less to do with talent and more to do with signaling. Internships have become a form of currency in a crowded market, and like any currency, their value declines as the supply increases. When “everyone” has experience, the market stops rewarding competence and begins rewarding timing and trajectory. The question shifts from “Are you qualified?” to “How early did you start?”
What makes this trend problematic is how it reshapes student behavior. High-achievers are incentivized to prioritize resume stacking over depth of learning. Instead of exploring diverse interests or building foundational skills, many optimize for whichever role they can secure earliest. The result is a pipeline that selects for those who understand the “game” early, rather than those who would necessarily perform best in the long run.
This does not mean the system is broken beyond repair, but it does mean students must think more strategically. If everyone is accumulating similar credentials, true differentiation must come from narrative. Ironically, the students who stand out in 2026 may not be those with the highest volume of internships, but those who can articulately explain why their specific experiences matter. Internship inflation is unlikely to reverse, but recognizing it as a signaling arms race is the first step toward navigating the recruiting cycle more intelligently.
Big Tech’s $700 Billion Bet
By Joe Hickey
AI infrastructure capital expenditures are expanding at a staggering rate, with 2026 estimates rising from $750 billion to approximately $800 billion, and 2027 projections now exceeding $1 trillion. Microsoft, Google, Meta, and Amazon are collectively on track to spend nearly $700 billion on data centers, chips, and cloud infrastructure in 2026 alone. The sheer scale of this buildout has triggered a central debate among investors: is this spending justified, or are Big Tech companies overcommitting to a speculative return?
The bull case argues that massive expenditures are a necessary response to real, rapidly growing demand that is already converting into revenue. Google serves as the primary evidence for this perspective; Google Cloud’s revenue grew 63% YoY to $20 billion in Q1 2026. Furthermore, the company’s cloud backlog reached $462 billion—nearly doubling in a single quarter—with over 50% expected to convert to revenue within the next 24 months. This suggests that Capex is translating into concrete returns rather than speculative growth. Similarly, Amazon’s AWS has successfully leveraged infrastructure spending to meet surging enterprise demand, driving revenue to $37.6 billion, a 28% YoY increase.
However, the bear case is becoming increasingly difficult to ignore. Investors fear that revenue growth will fail to keep pace with Capex, ultimately crushing free cash flows. Despite the revenue gains at Google and AWS, Amazon’s free cash flow collapsed 95% YoY to $1.2 billion, while quarterly Capex alone hit $44.2 billion. With $200 billion in total Capex committed for 2026, Amazon’s free cash flow is projected to turn negative. Meta’s situation is perhaps the most scrutinized; CEO Mark Zuckerberg has recently struggled to provide a concrete timeline for a return on these investments. Despite this uncertainty, Meta has deviated from its historically capital-light model, increasing its Capex guidance to a range of $125–$145 billion.
From a macroeconomic standpoint, this infrastructure buildout is creating a massive demand for electricity that the current grid is unprepared to handle, offering significant opportunities for energy companies. Furthermore, Morgan Stanley estimates that Big Tech will face a $1.5 trillion financing gap to fund these ambitions. This suggests these firms will need to raise significant debt, potentially putting upward pressure on corporate borrowing costs across the entire market. Ultimately, Big Tech is placing a hundred-billion-dollar bet that revenue will eventually justify the cost—a gamble that will likely define the market’s trajectory for years to come.
The Market’s Dependence on Rate Cuts Is Becoming Its Biggest Risk
By Sohan Garg
Recently, financial markets have been behaving in a way that feels almost irrational. When economic data comes in “weak”—whether through softer inflation or slower job growth—stocks often move higher. Conversely, strong data can trigger sudden selloffs. This reaction is the inverse of how traditional markets are expected to function, and it reveals a critical shift: the market is no longer trading purely on economic fundamentals, but rather on the anticipated reaction function of the Federal Reserve.
The key shift is that investors are no longer reacting to the data itself, but to how the Fed will respond to that data. If inflation comes in lower than expected, the immediate assumption is that rate cuts are approaching, which is net-positive for equity valuations. On the other hand, robust economic data signals that the Fed may keep rates “higher for longer,” putting downward pressure on multiples. As a result, the traditional cause-and-effect relationship between the economy and the markets now has a complex layer of policy interpretation that investors must constantly navigate.
This creates a “Goldilocks” scenario that is as fragile as it is optimistic. The market is essentially pricing in a perfect outcome—where inflation cools sufficiently to justify rate cuts, yet the economy avoids a meaningful slowdown. This is a remarkably narrow path that depends entirely on the Fed’s timing being flawless. If inflation proves to be more persistent than expected, or if the Fed delays the pivot, markets will likely be forced into a violent repricing.
What stands out is that the core risk is no longer centered on economic strength or weakness; instead, it is centered on policy dependency. Much of the current optimism feels less like a vote of confidence in underlying corporate fundamentals and more like a bet that the Fed will provide a “liquidity backstop” whenever stress arises.
A market that rises on bad news may appear resilient on the surface, but it actually highlights a deep-seated reliance on monetary easing. This suggests that the current rally is built on the expectation of lower rates rather than organic growth. If that expectation shifts, the ensuing market reaction could be far sharper than most participants currently anticipate.
The Hidden Cost of Private Credit
By Isaias Plascencia
Middle-market companies—those with $10 million to $1 billion in annual revenue—have increasingly turned to private credit lenders as traditional banks have retreated from leveraged lending following the 2008 financial crisis. Consequently, Business Development Companies (BDCs), which serve as packaged vehicles for private credit, have filled this gap to become a primary capital source for these borrowers. While this initially appears to be a win for the middle market, this access to previously restricted debt markets carries a hidden cost that directly impacts the balance sheet.
By law, BDCs must distribute 90% of their taxable income to shareholders, a requirement that significantly limits their capacity to absorb or mitigate losses. Furthermore, a 2018 regulatory change allowed BDCs to double their debt-to-equity ratio from 1:1 to 2:1. While this increased leverage is notable, it may actually be understated. Many BDCs have begun taking majority stakes (~75% ownership) in secondary lending companies that carry their own debt loads—debts that are often not required to be visible on the parent BDC’s balance sheet. This means a BDC reporting a 1.2x leverage ratio to shareholders might actually be maintaining a ratio closer to 1.6x upon deeper inspection.
For middle-market borrowers, this creates a hidden layer of systemic risk. The complexity of these arrangements is illustrated by a recent contagion involving HSBC and Apollo. HSBC extended credit to an Ireland-registered Apollo subsidiary, which in turn lent to a UK vehicle, Zircon Bridging. That vehicle then maintained agreements with a mortgage broker, Market Financial Solutions (MFS). This structure created three distinct layers of separation between the bank and the ultimate capital. When MFS collapsed in February due to a double-pledging collateral scandal, HSBC was forced to recognize a $400 million loss on exposure for which it had essentially “outsourced” due diligence.
The Financial Stability Board has flagged this as a critical issue: as banks lend into private credit, capital travels through multiple opaque layers, creating a “masking effect” where no single entity has a clear view of the total risk sitting on the balance sheet. For the middle-market companies at the bottom of this chain, their survival increasingly depends on the transparency of a system that is designed to hide its own weight.
Peeling Back the Curtain on a Tech-Led Rally
By Gloria Liu
U.S. equities delivered a remarkable performance this week, with both the S&P 500 and the Nasdaq hitting all-time highs on Friday. The S&P 500 finished at 7,398.93 points, marking six consecutive weeks of gains for both indexes. The primary catalyst was an April jobs report that caught Wall Street off guard: the U.S. added 115,000 jobs—significantly higher than the anticipated 65,000—while unemployment held steady at 4.3%. On the surface, these figures suggest an economy that remains remarkably resilient.
However, a deeper look at the market’s internal mechanics suggests reason for concern. The current rally is increasingly carried by a shrinking group of stocks, dominated almost exclusively by AI-related names. This “concentration risk” is evidenced by the massive performance gap between indexes: while the Nasdaq surged 4.5% on the week, the Dow Jones Industrial Average—which tracks more traditional industrial and value companies—gained a mere 0.22%. This divergence matters; when a handful of tech giants are the sole drivers of upward momentum, the market’s foundation becomes significantly more fragile than headline numbers suggest.
I am also concerned about the fraying consumer landscape. We are seeing a “K-shaped” reaction to current price levels: lower-income households are already significantly cutting back on fuel consumption and discretionary spending due to high prices, whereas wealthier households have yet to change their behavior. Since consumer spending drives roughly 70% of the U.S. economy, a pullback at the lower end of the income spectrum will eventually manifest as slower growth and weaker corporate earnings—even if the stock market hasn’t priced in that reality yet.
While six straight winning weeks is an impressive streak, its reliance on a narrow tech leadership makes it vulnerable. If the lower-income consumer continues to retrench, that pressure will inevitably hit corporate bottom lines. Investors should be cautious about reading too much into the headline record highs; the underlying “health” of the market is more nuanced than it appears.